
Amidst intensifying global market competition, advertisers are pivoting their strategies significantly. Unity's recently released "2024 Mobile Growth and Monetization Report" encapsulates key trends in mobile gaming ads and growth monetization for 2024.
The report highlights as follows:
1. Advertisers are adopting more agile and diversified strategies.
2. The emphasis on CPI optimization is diminishing, while IAA and hybrid models gain traction.
3. Leading game genres are focusing on IAA optimization.
4. IAP users exhibit higher value in secondary conversions.
5. IAA users' engagement with ads is on the rise.
The insights and analysis from the report, curated by NetMarvel, leverage data-driven insights to help global advertisers grasp trends and iterate growth strategies.
01/The Diverse Tactics in Advertisers' Campaigns
Acquiring the right users economically and efficiently remains the ultimate challenge for game developers. Currently, an increasing number of marketers are experimenting with diverse ad strategies, such as CPI ad optimization, event-driven optimization, and various ROAS strategies, to identify more valuable users.
Diversifying ad strategies is key in the current gaming industry. While CPI (Cost Per Install) campaigns remain a top choice for some advertisers, there has been a noticeable shift in ad budget allocation. As illustrated in the chart below, the weight of CPI in ad spending has been continuously decreasing since 2022, with IAA (In-App Advertising) showing steady growth. Additionally, the weight of IAP (In-App Purchases), tCPE (Target Cost Per Engagement), and hybrid ad strategies has remained stable.
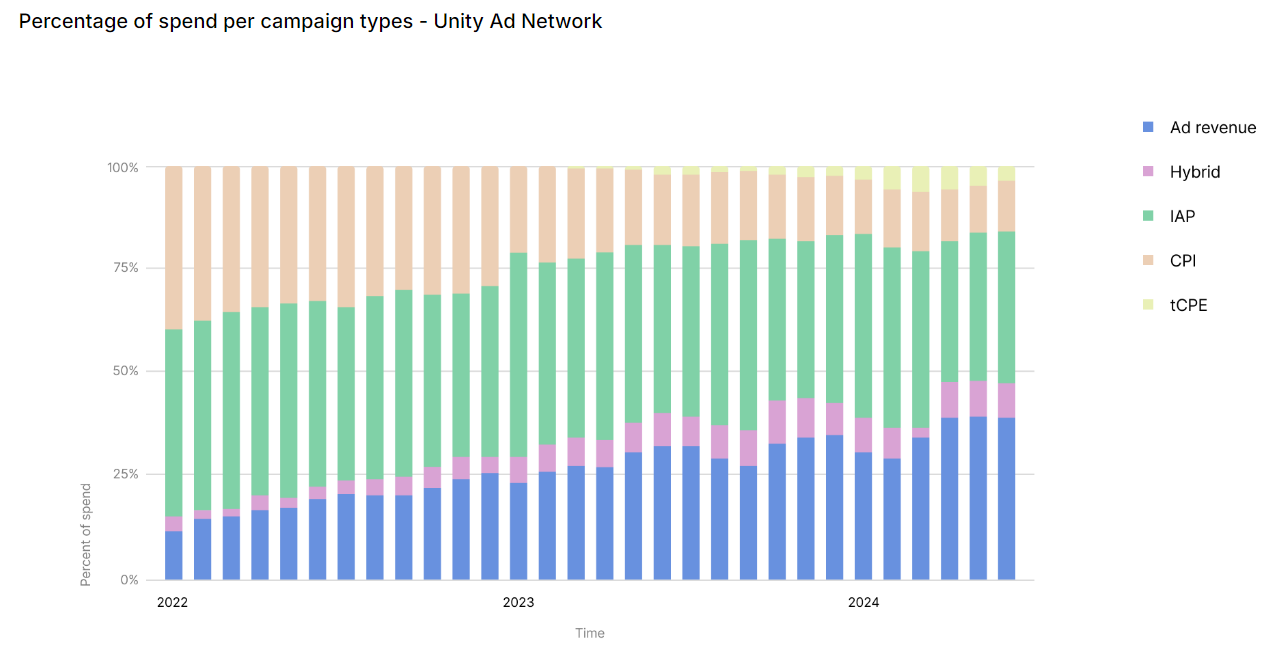
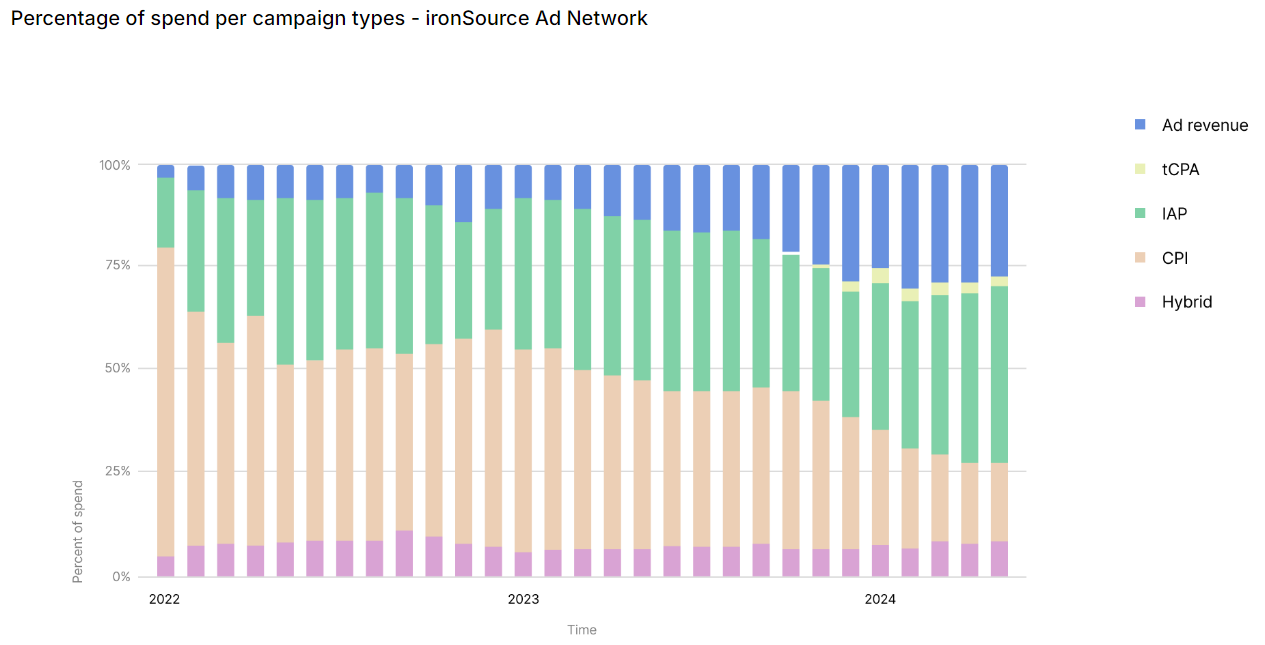
The weight of each advertising spend type - Unity & ironSource
Based on a 7-day ROAS benchmark, it's evident that the highest-spending game genres are primarily focused on IAA ad optimization. For instance, simulation games (61.5%) and hyper-casual games (54.2%). Notably, hybrid ad optimization is hot on its heels, ranking as the second preference. Combining IAA and IAP optimization helps establish a more stable and flexible strategy, adapting to varying user preferences and market conditions, hence its growing popularity.

The highest-spending game category's 7-day ROAS by ad spend type
From the analysis of the top five game categories by ad spend, a trend towards diversification and dispersion in ad optimization strategies is evident. For instance, in strategy games, the weight of IAP optimization soars above 70%, whereas this ratio dips below 10% in arcade games. Moreover, tCPE (True Cost Per Engagement) is also making its mark in puzzle games (3%), strategy games (8%), casino games (2%), and arcade games (4%), indicating that the growth strategies for these genres are shifting towards directly acquiring high-quality users.
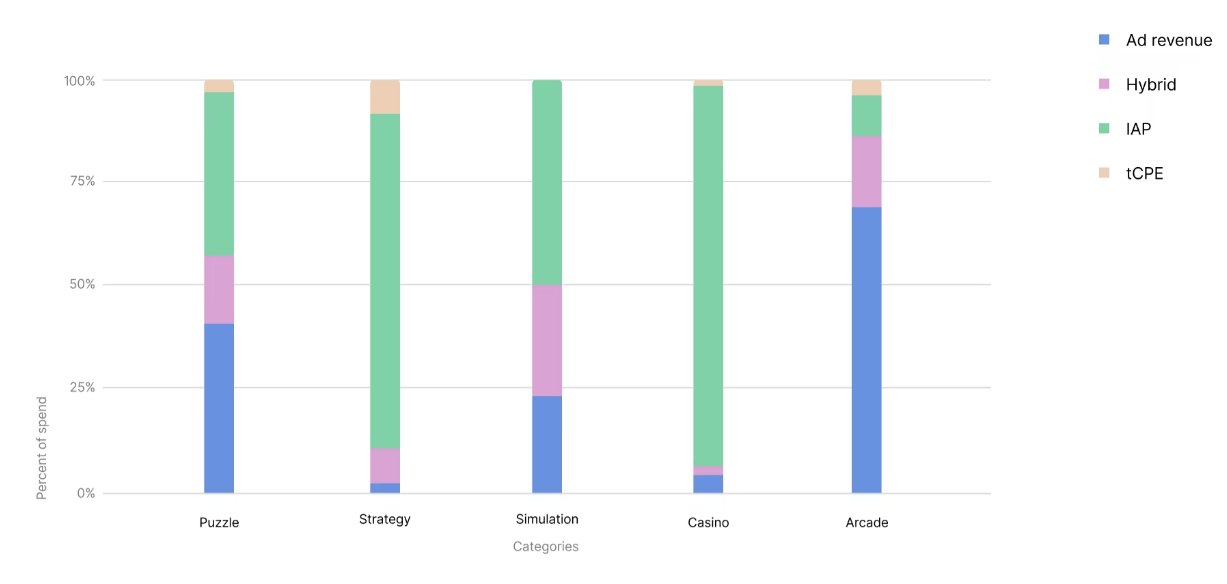
Top 5 US game categories' ad spend mix
02/Higher Re-conversion Value for IAP Users
In-app purchases (IAP) are pivotal in driving game revenue, with data showing that once players make their initial purchase, the probability of them making subsequent purchases significantly increases.
During the lifecycle of a player, approximately 1.83% of users will make a purchase. Among these paying customers, about 28.8% are likely to conduct at least one additional purchase, accounting for roughly one-third of IAP users. Delving into the payment cycles of IAP users, 77% of them complete their first payment within two weeks. Within the first 30 days following the initial payment, 26.47% of users will make a repeat purchase; between 31 to 60 days, this figure stands at 1.37%; and beyond 61 to 90 days, the proportion is 0.46%.
Compared to promoting first-time payment conversion among users, encouraging existing IAP users to make a second purchase is a more valuable and less difficult task.
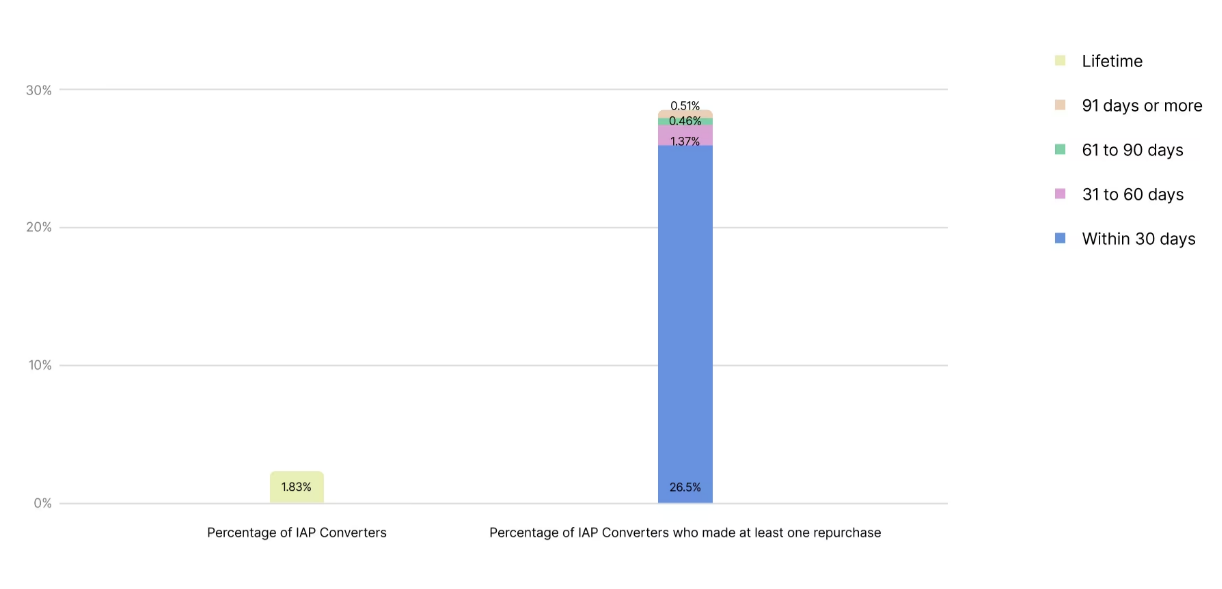
The Conversion Rate of IAP Users
By segmenting the game into its early phase (first week), mid-phase (second week), and late phase (third week and beyond), significant differences in the weight of influence of various IAP product types across different stages become apparent. In the early phase, the top three converting products are ad removal (7.0%), membership subscriptions (3.7%), and starter packs (3.1%). As the game progresses into its mid-to-late stages, the weight of in-game currency and time-limited events becomes the most significant.
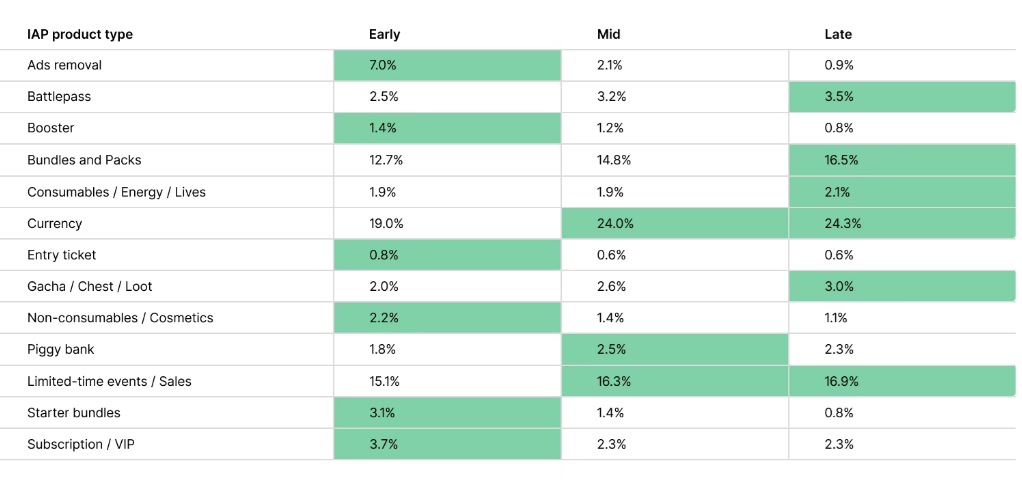
The Most Effective IAP Product (Among Three Stages)
03/The Rising Ad Engagement for IAA Users
With increased macroeconomic pressures, both the engagement (percentage of users who have interacted with at least one ad) and depth (ratio of average number of viewed ads to the total) of IAA have seen significant global increases.
In 2023, user engagement with rewarded video ads saw a year-over-year increase of 3.2%. In the T1 and T2 markets, the growth exceeded 4%. A significant factor behind this is the economic downturn, which has constrained people's ability and willingness to make in-app purchases. Consequently, advancing in-game progress by watching ads has become a popular choice for many users, enhancing the value of In-App Advertisements (IAA).

Incentivized Video Ad Performance (YoY 2023 vs 2022)
Across various game genres, the majority see ad engagement rates above 30%. Word games lead with the highest engagement at 38.4%, followed by role-playing games (37.6%), casual games (36%), and simulation games (35.3%). Even the genres with the lowest engagement, such as sports, puzzle, and action games, all exceed 25%. Thus, the importance of rewarded video ads should not be underestimated in any category.
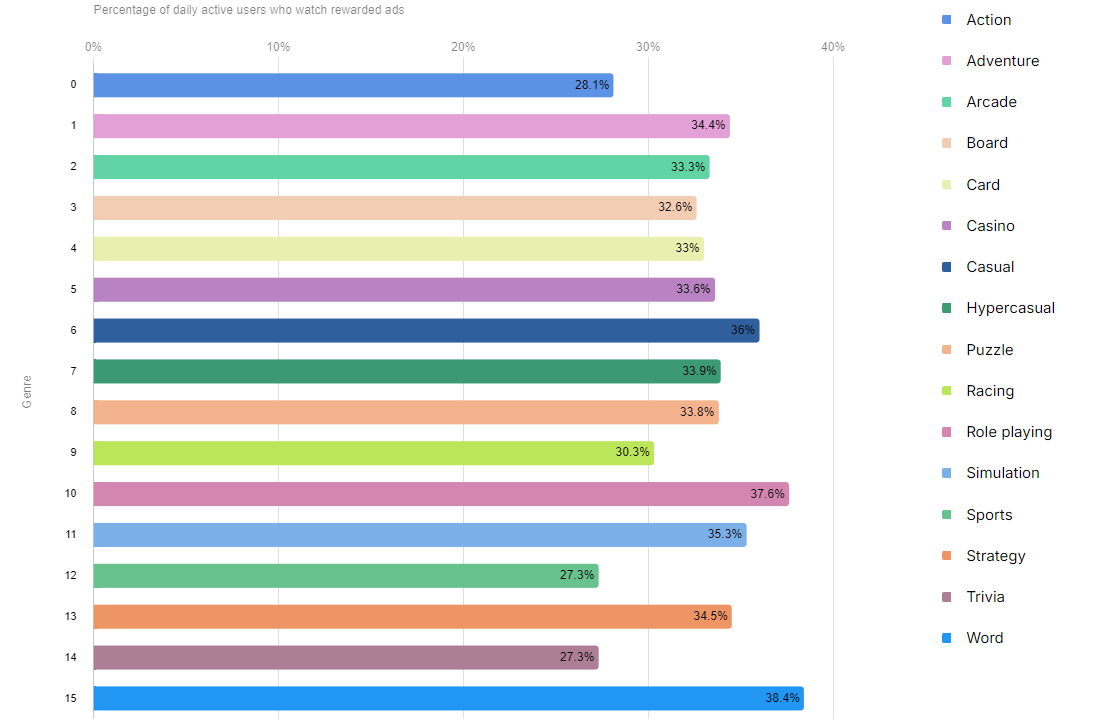
Engagement Level Incentivized Video Ads (Across Different Game Categories)
Besides, Casino, sports, and word games excel at driving ad views. Typically, players in these genres watch more than five ads per user, and they tend to have longer playtimes. However, these games need a steady stream of resources to support player progression.
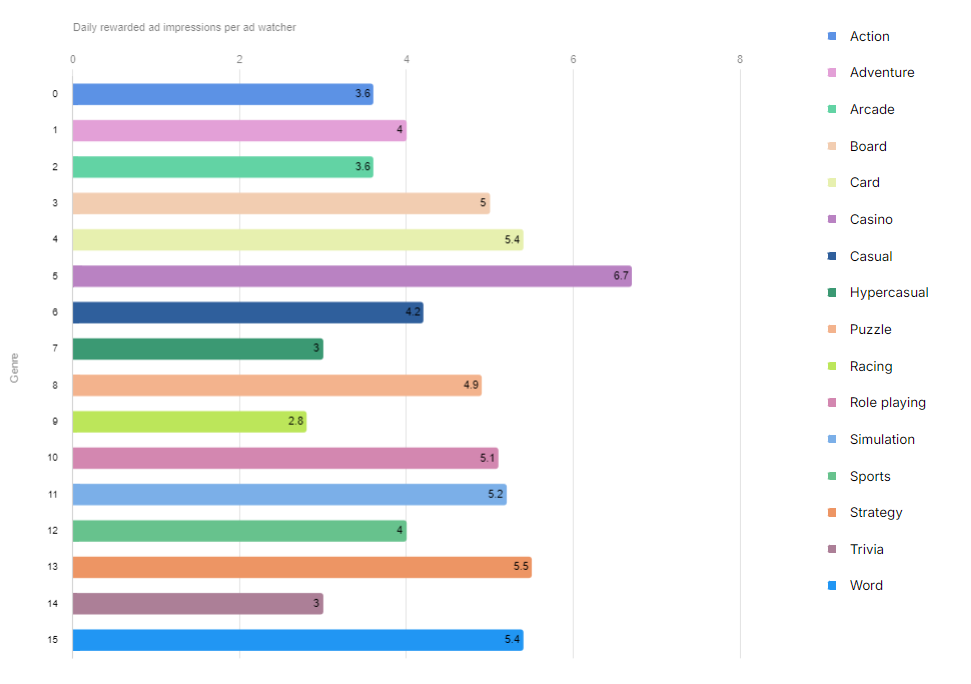
Views Per User Incentivized Video Ads (By Game Category)
Offering rewards when users are most likely to benefit from them enhances engagement with rewarded ads. For instance, presenting contextually relevant ads when players are out of resources, like health points, can drive 38.1% of users to watch ads. Strategic placement of these prominent and need-based reward ads not only boosts ad participation but, more importantly, enriches the user experience.
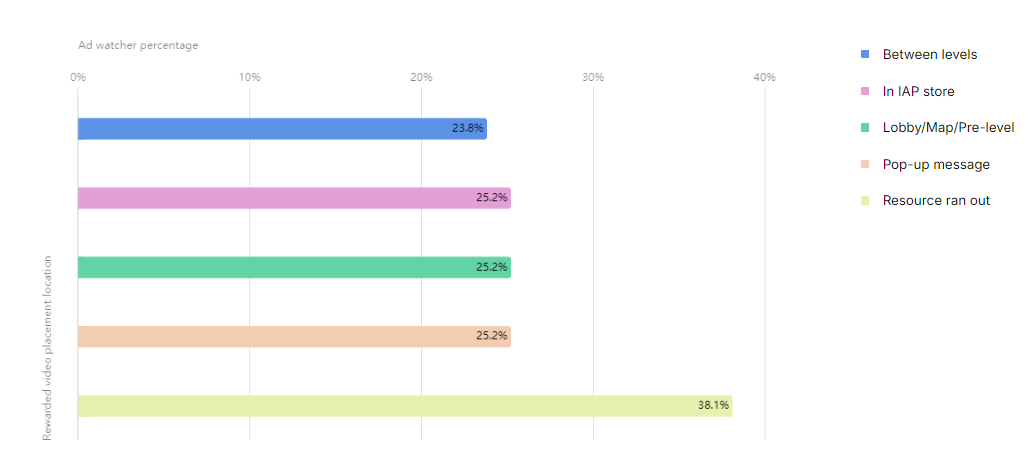
User Engagement Incentivized Video Ads (By Location)
Striking the right balance between gameplay and ad engagement isn't about minimizing ads. Data indicates that when the number of rewarded ads is set between 15 to 20, engagement can reach 46%. To maintain high ad engagement, offering a variety of rewarded video formats is recommended, including short, long, small, and large videos, to cater to diverse user needs and preferences.
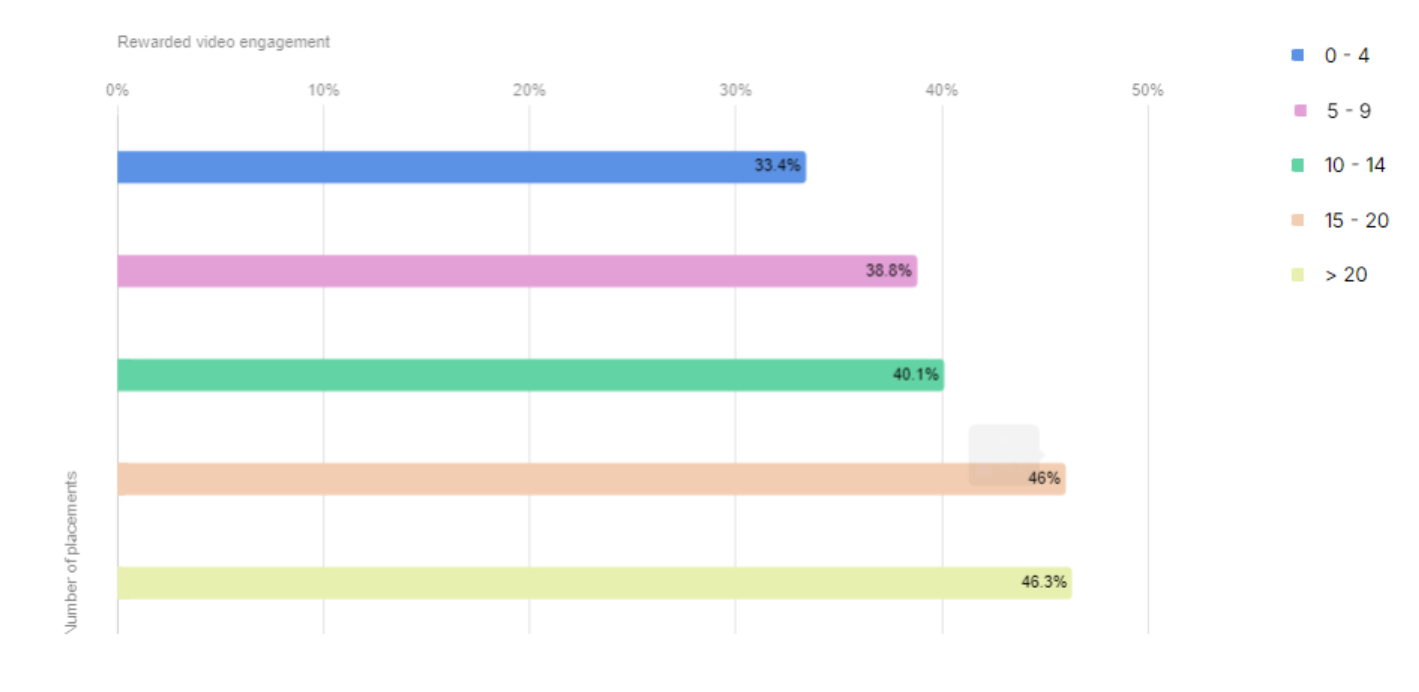
User Engagement Incentivized Advertisements (Across Various Quantities)


